Taking shortcuts and outright cheating is the hallmark of a great developer. I like creating graphics, both visualisations and pretty maps but I often don’t have the time to spend hours making one from scratch. In this blog I’m going to explain the process that I took to create a quick and dirty map navigation tool.
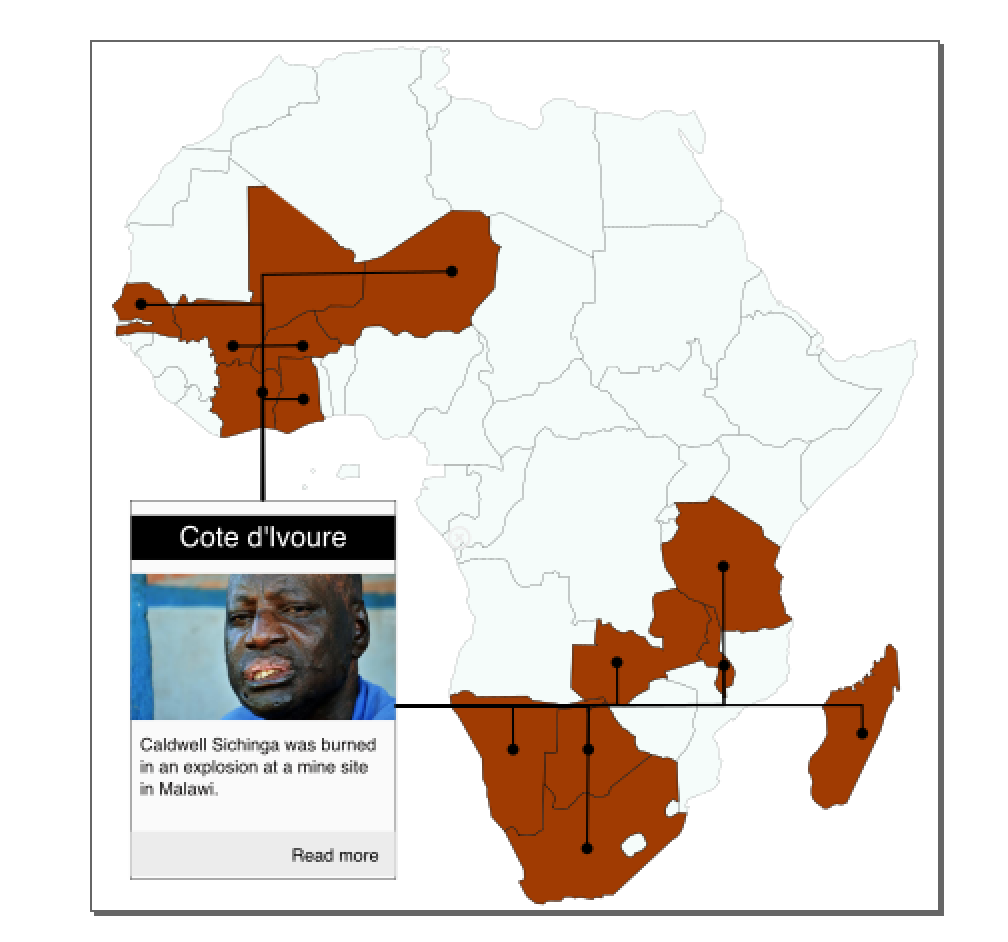
I’m going to take you through the steps that I took to create the following graphic:
Step 1: Find a base map
The first step is to find a base map to work with. I grabbed a free one which you can find here.
Step 2: Annotate the map with IDs and classes
The next step is to annotate the base map with ids so that you can directly address each country shape individually. Luckily the svg map that I found already contained country ids.
<path
style="fill:#000000;fill-opacity:0;stroke:#000000;stroke-linecap:round"
d="m 794.44336,1010.9141 -58.18945,46.1504 ....."
id="South_Africa"
/>
I also added a class to each country boundary that I was interested in (i.e. the brown countries in the map above). The xml now looks like this:
<path
style="fill:#000000;fill-opacity:0;stroke:#000000;stroke-linecap:round"
d="m 794.44336,1010.9141 -58.18945,46.1504 ....."
id="South_Africa"
data-name="South Africa"
class="story-country" />
The data-name attribute is where we store the human-readable version of the country’s name. We’ll see how it is used later.
Step 3: Add graphical elements
The cheating part is here. Rather than writing complex code to dynamically add lines and the infobox, I simply created it all in Inkscape:
Notice that all the lines are visible which means it’s going to look messy. We’ll fix that in the javascript.
For the pointer lines, I added relevant class at ID attributes:
<g class="pointer" id="Ghana_pointer">
<circle
r="8.0432596"
cy="507.66473"
cx="301.8309"
id="circle8459"
style="...." /><path
sodipodi:nodetypes="ccc"
inkscape:connector-curvature="0"
id="path8461"
d="m 243.73392,651.2675 ..."
style="..." />
<path
sodipodi:nodetypes="ccc"
inkscape:connector-curvature="0"
id="path8461"
d="m 243.73392,651.2675 0.3255,-143.59047 50.81562,-0.0515"
style="fill:none;fill-rule:evenodd;stroke:#000000;stroke-width:3.04408622;stroke-linecap:butt;stroke-linejoin:miter;stroke-miterlimit:4;stroke-dasharray:none;stroke-opacity:1" />
</g>
</g>
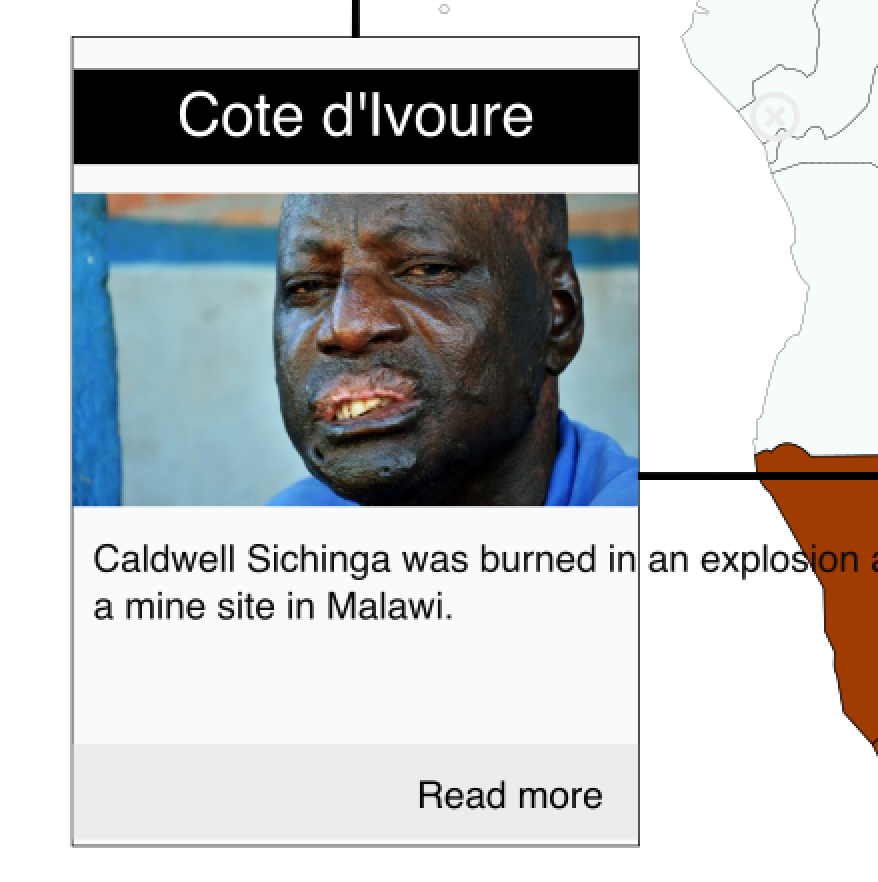
I also created the infobox, and added the appropriate elements, textbox, title, image etc. A little used svg tag is <xlink:href=”…”> which lets you link to resources outside of your svg. In this case an image.
<image
xlink:href="img/botswana.jpg"
width="..."
height="..."
x="..."
y="..." />
I also used it for the “Read more” link at the bottom.
Step 4: Damn! It turns out that our text doesn’t wrap
SVG is not a particularly good mark-up language when it comes to dynamic text, word wrapping in particular. SVG doesn’t have a concept of a dynamically sizing box. What this means is that if you want to change the text in the infobox on the fly, you don’t have any idea about how long it’s going to be. You end up with text that doesn’t wrap and flows out of your text area. Yuck!
What to do?
HTML to the rescue. SVG allows for embedding of foreign mark-up languages inside it. HTML is perfect for word wrapping. The entire philosophy behind HTML is that you don’t know what the size of your viewport is when developing and allows for dynamic resizing of containers. Here is the magic code:
<foreignObject
width="345"
height="130"
y="970"
x="190">
<xhtml:p class="body-text">Hover your mouse over each highlighted country for more information.</xhtml:p>
</foreignObject>
Notice the <xhtml:p> tag. That’s basically what our plain *<p> tag looks like when it hangs out in SVG land.
Step 5: Right, let’s get javascripting
First we create a json object with the data that we want to display in the map:
var data = {
Botswana : {
body : 'The painful plight of a landless farmer',
image : 'img/botswana.jpg',
url : 'http://fatalextraction.investigativecenters.org/2015/07/10/the-painful-plight-of-a-landless-farmer.html',
},
Burkina_Faso : {
body : 'Conflit de travail à Gryphon Minerals',
image : 'img/burkina_faso.jpg',
url : 'http://fatalextraction.investigativecenters.org/2015/08/05/conflit-de-travail-%C3%A0-gryphon-minerals.html',
},
/* Add data for more countries here */
}
I used d3js to help me manipulate my DOM. JQuery would probably have been a better tool but I know d3 pretty well and I couldn’t be bothered to figure stuff out with JQuery.
There are many ways to go about this but I defined a Map object and a Pointers object. The Pointers object* object is quite basic. It controls those black lines and circles that point to each country. My strategy is to hide them all and then only make the one that I am interested in visible. The constructor is passed the root container object. Inside it collects all the pointer objects using .selectAll(‘.pointer’). It has two methods, hide_all and display_pointer both of which do what’s written on the packaging.
Pointers are hidden by adding a CSS class hidden which is defined elsewhere but pretty much controls the visibility of the elements.
var Pointers = function(root_node) {
this.root_node = root_node;
this.pointers = this.root_node.selectAll('.pointer');
}
Pointers.prototype = {
hide_all : function() {
this.pointers.classed('hidden', true);
},
display_pointer : function(country) {
var pointer = this.root_node.select('#' + country + '_' + 'pointer');
pointer.classed('hidden', false);
}
}
The Map object manages the points and handles all the mouse over and click events.
var MapObj = function(root_node) {
this.selected = false;
this.mapnode = root_node;
this.pointers = new Pointers(root_node);
this.pointers.hide_all();
this.enable_mouseover();
this.enable_click();
}
MapObj.prototype = {
enable_mouseover : function() {
var me = this;
this.mapnode.selectAll('.story-country').on('mouseover', function(el) {
var country = this.id;
me.process_mouseover(country)
});
},
disable_mouseover : function() {
this.mapnode.selectAll('.story-country').on('mouseover', null);
},
enable_click : function() {
var me = this;
this.mapnode.selectAll('.story-country').on('click', function() {
var country = d3.select(this);
var is_pressed = country.classed('selected');
d3.selectAll('.story-country').classed('selected', false);
if (is_pressed) {
me.enable_mouseover();
} else {
country.classed('selected', true);
me.disable_mouseover();
me.process_mouseover(this.id);
}
});
},
process_mouseover : function(country) {
var country_obj = d3.select('#' + country);
var infobox = d3.select('#infobox');
this.pointers.hide_all();
this.pointers.display_pointer(country);
infobox.select('#title').text(country_obj.attr('data-name'));
if (data[country] != undefined) {
infobox.select('.body-text').text(data[country]['body']);
infobox.select('image').attr('xlink:href', data[country]['image']);
infobox.select('#read-more')
.attr('xlink:href', data[country]['url'])
.attr('xlink:show', 'new')
}
}
}
Of interest is the process_mouseover method. It is called when you move your mouse over a country. If you look at line 43, you will see how we use the data-name attribute that I mentioned earlier to set the title of the infobox. The reset of the contents are entered into the infobox, i.e. the body text, image and link to the article.
One last bit of boilerplate that I use to launch this entire thing off. The main bit here is where the SVG file is imported and inserted into the HTML page’s DOM. In line 2, I get a reference to a div tag in the html with an id attribute of map. Lines 3 and 4 are where the SVG is loaded into the HTML’s DOM. You don’t really need to understand how it works, just copy and paste.
d3.xml('map.svg', function(xml) {
var map = d3.select('#map');
var importedNode = document.importNode(xml.documentElement, true);
var img = map[0][0].appendChild(importedNode.cloneNode(true));
var mapobj = new MapObj(map);
// cache images
images = []
for (k in data) {
images.push(data[k].image);
}
d3.select("body").append("div")
.style("display", "none")
.selectAll("img")
.data(images)
.enter()
.append("img")
.attr("src", String)
});
To see how the whole thing works, you can download these files and piece them together: data.js, map.js, map.html, map.svg.
It might seem like a lot of work but you can easily use this code as a template for other similar visualisations.


