The National Crime statistics for 2017 - 2018 were just released. This eagerly awaited dataset often paints a disturbing picture of crime in South Africa. According to the data, 57 people are murdered in South Africa everyday, the majority in the Western Cape. Ignoring the seriousness of the data, I am going to use it to demonstrate a useful technique that can help make your dataset more machine-friendly.
You can download the raw data here if you want to follow along.
I’m using LibreOffice so the first few steps might be different in Excel (actually, there is a chance you can do this in Excel anyway but I’m not sure). In the .xlsx file you will see three sheets with summary information. The data contains information on crimes for years between 2008 and 2017. Looking at the station statistics sheet, you see raw figures per police station. Nice, but not useful for analysis across police stations or geographical areas.
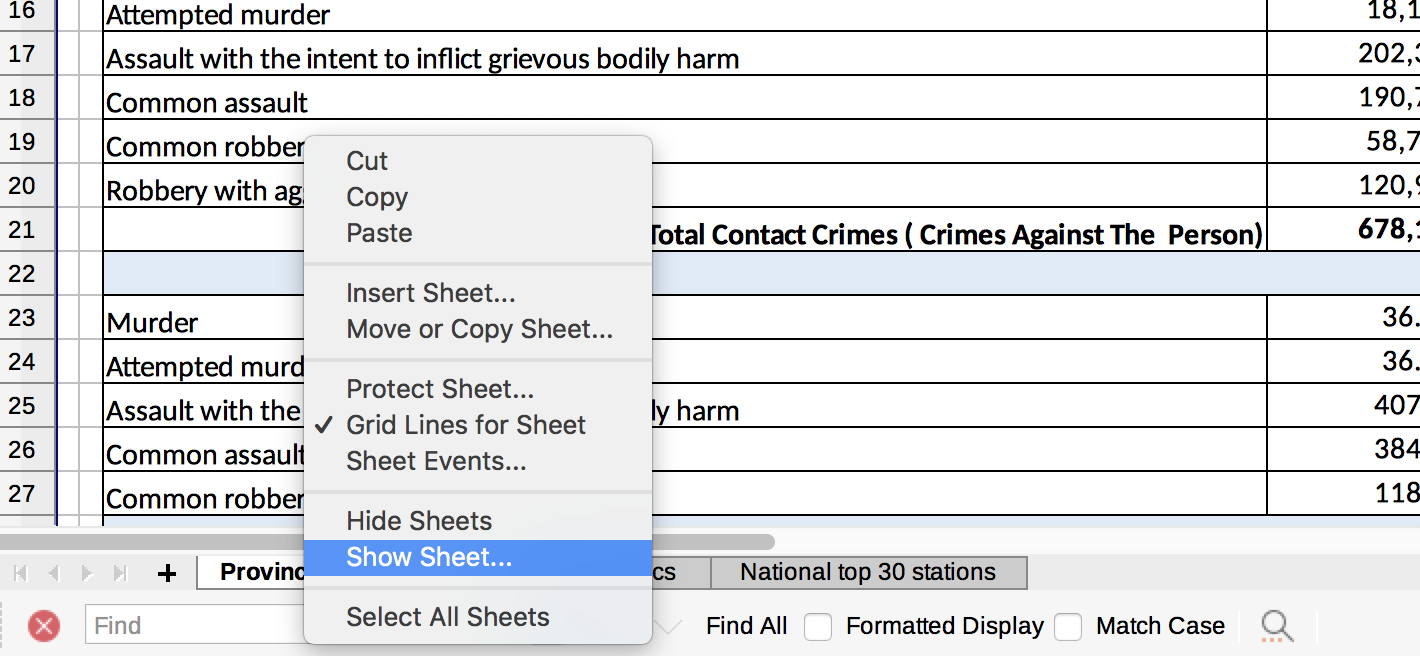
Luckily you can find the complete raw data in a hidden tab. Right click on the tabs at the bottom and you get an option Show Sheet….
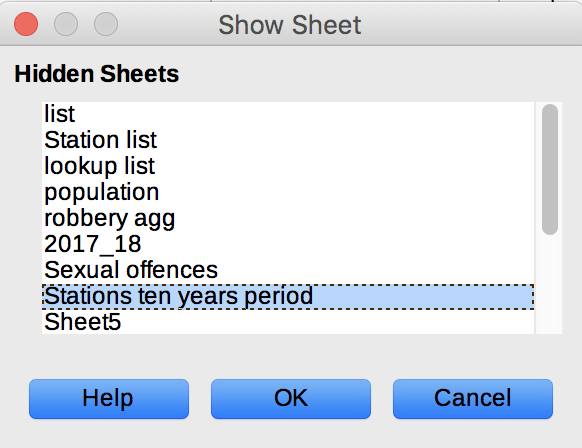
Selecting that option you are shown a list of all of the hidden sheets. In this case, we want the Stations ten years period sheet.
That’s much better. This sheet contains the raw data. Each row represents a crime category - station combination. For example, row 18366 contains the number of incidents of contact crime reported at the Goedmoed police station over the period of 2008 - 2017. The number of incidents per year is stored in a separate column for each year.
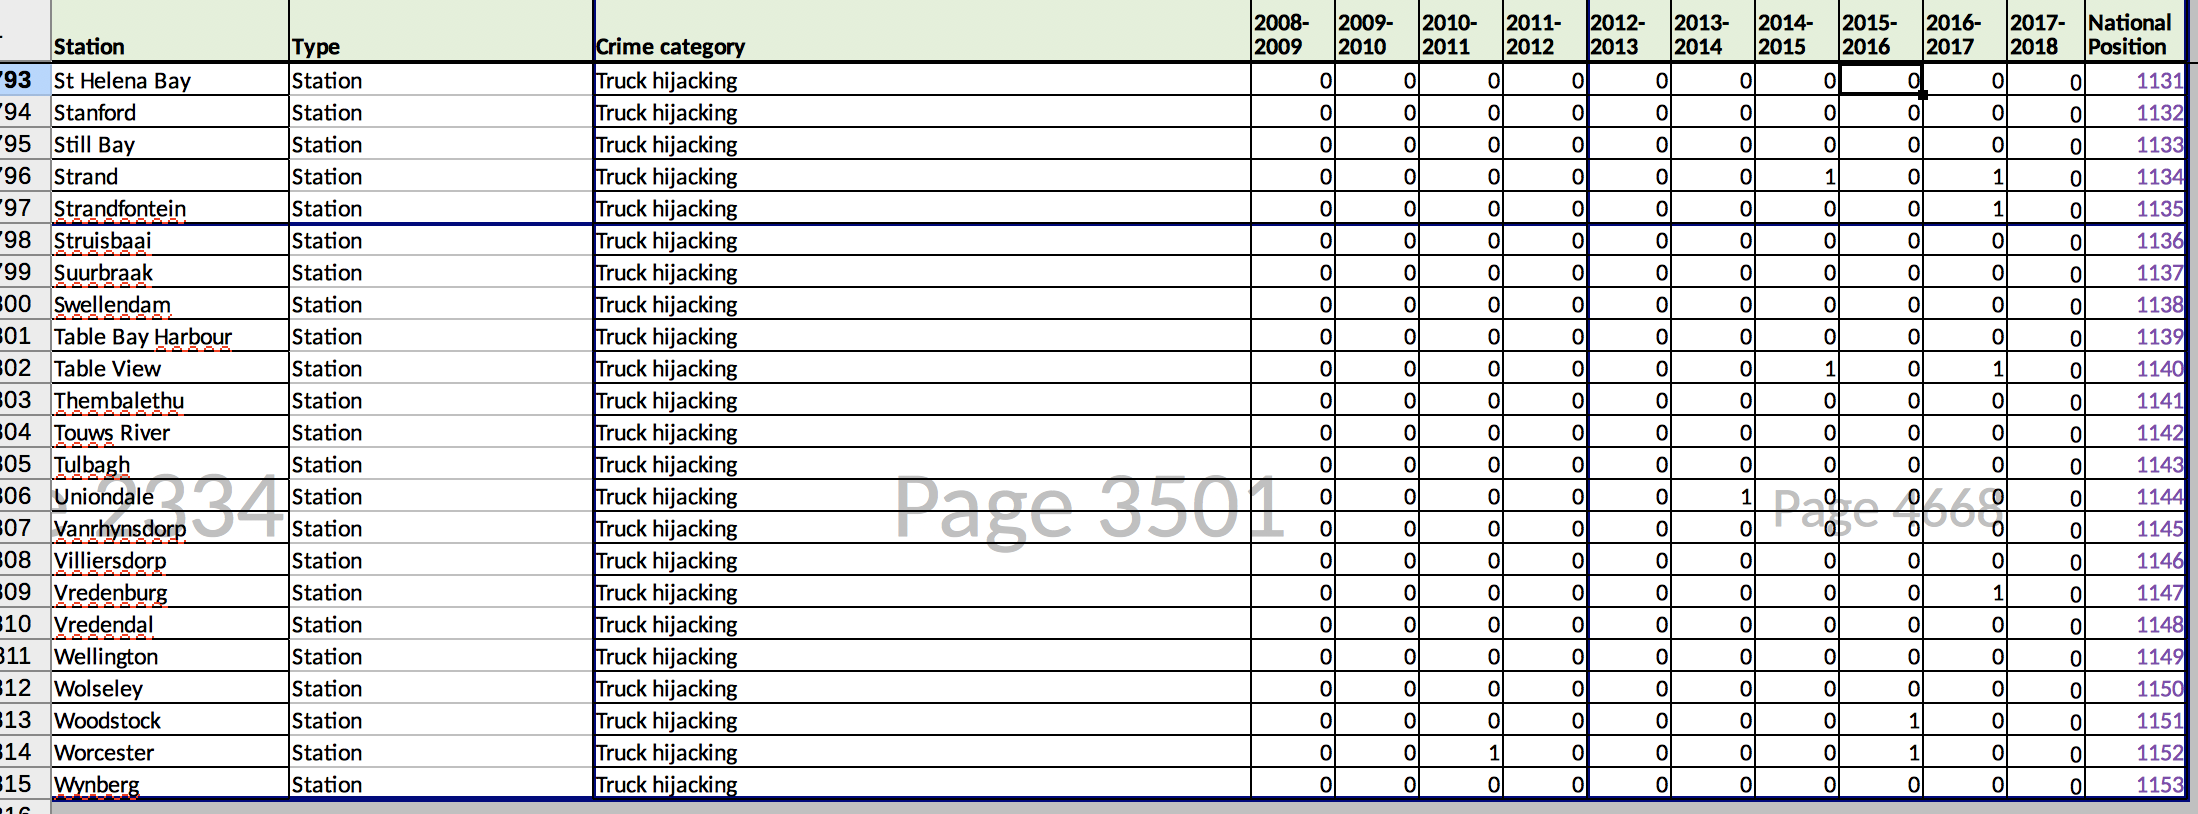
It would be better replace columns H-Q with two new columns:
- year
- number of incidents
Notice that this is the opposite of pivoting, i.e. you could recreate this dataset by pivoting using police station and crime category in the rows and year in the columns.
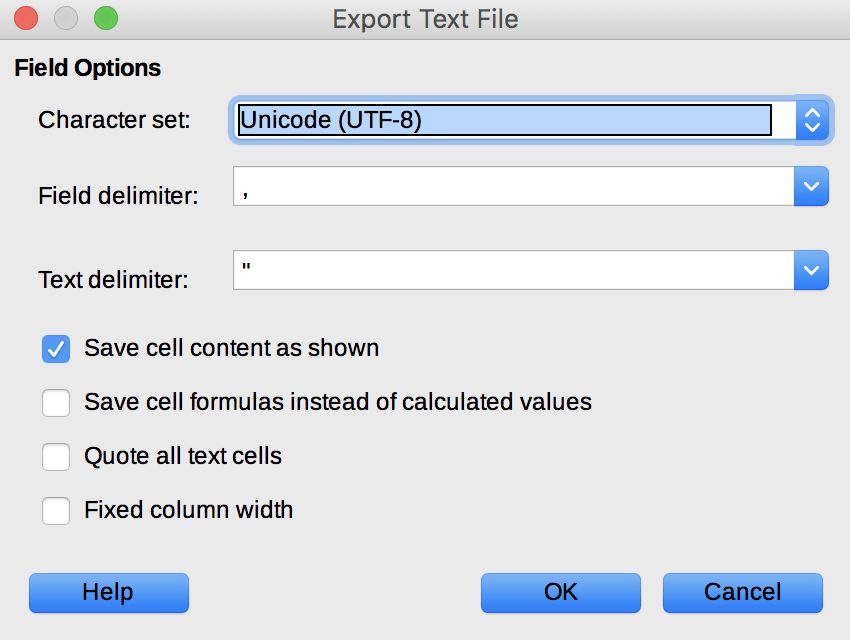
Unpivoting is useful so that we can create a different pivot table, say province in the rows and incidents in the columns. It is a more versatile way to structure the data. Let’s see how we go about it. We first export the data as a csv (strictly not needed but I prefer csv to xlsx).
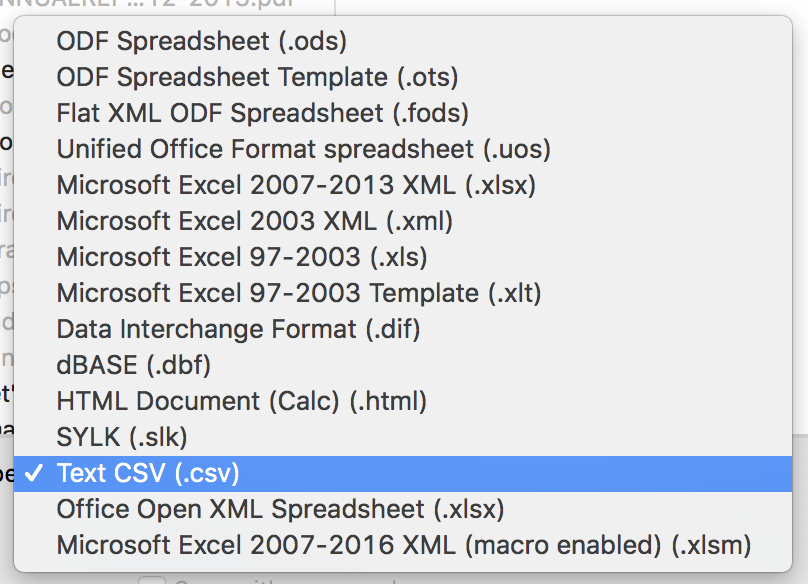
Ignore the warnings and confirm that you want to save as a .csv
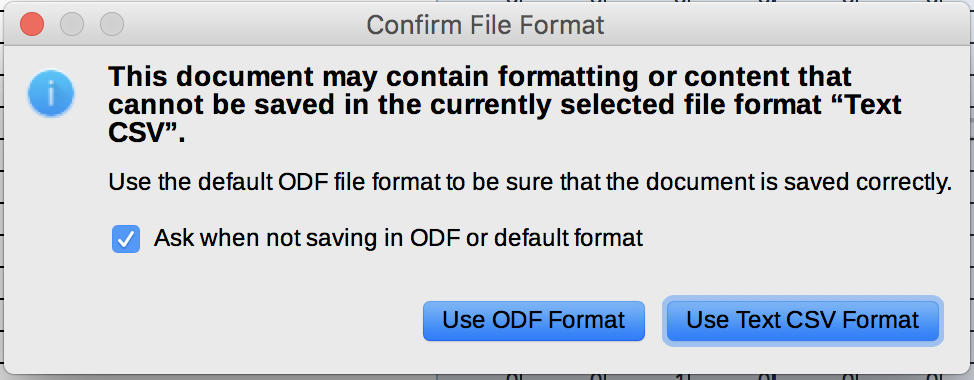
Blah blah blah - so many questions. Hurry up already!
Now my favourite part, load the data into OpenRefine.
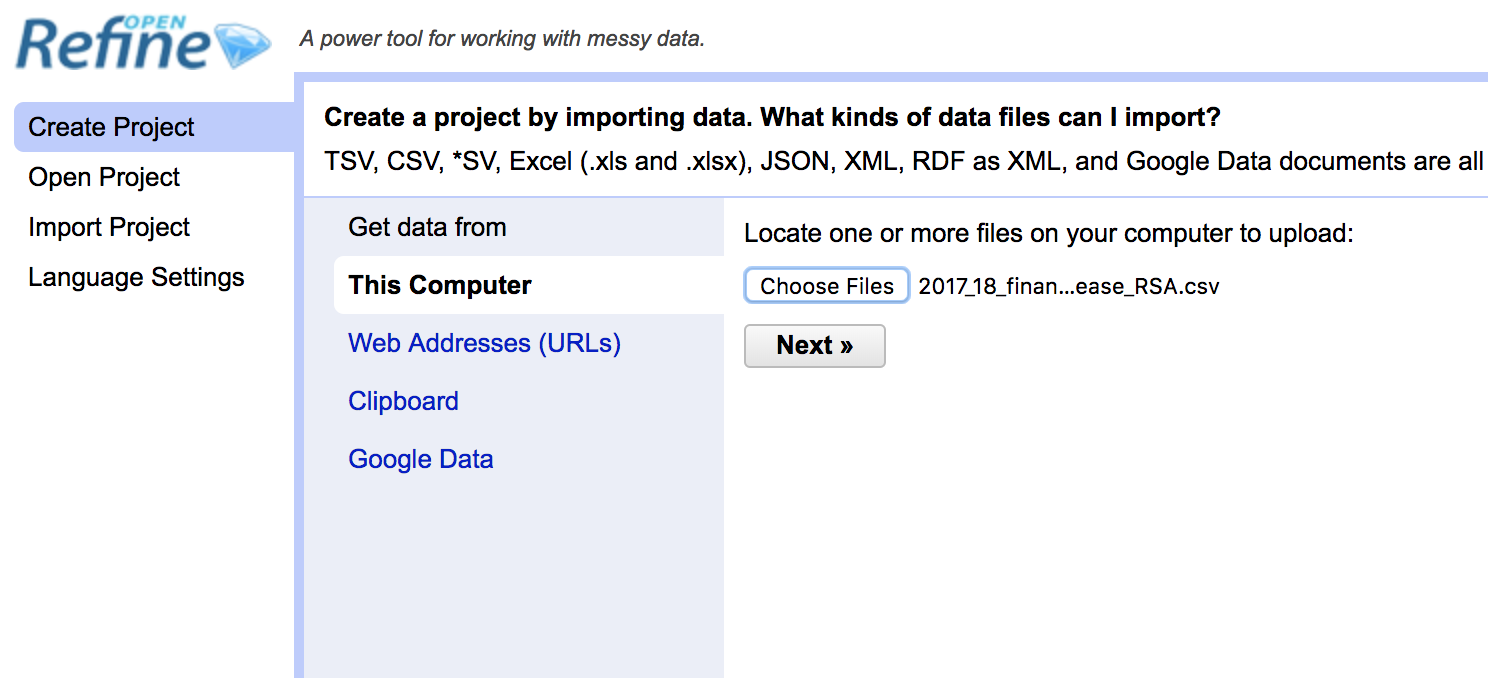
There you go, the raw, unvarnished data. 43,814 rows. There are a few columns that I am not interested, so I removed them.
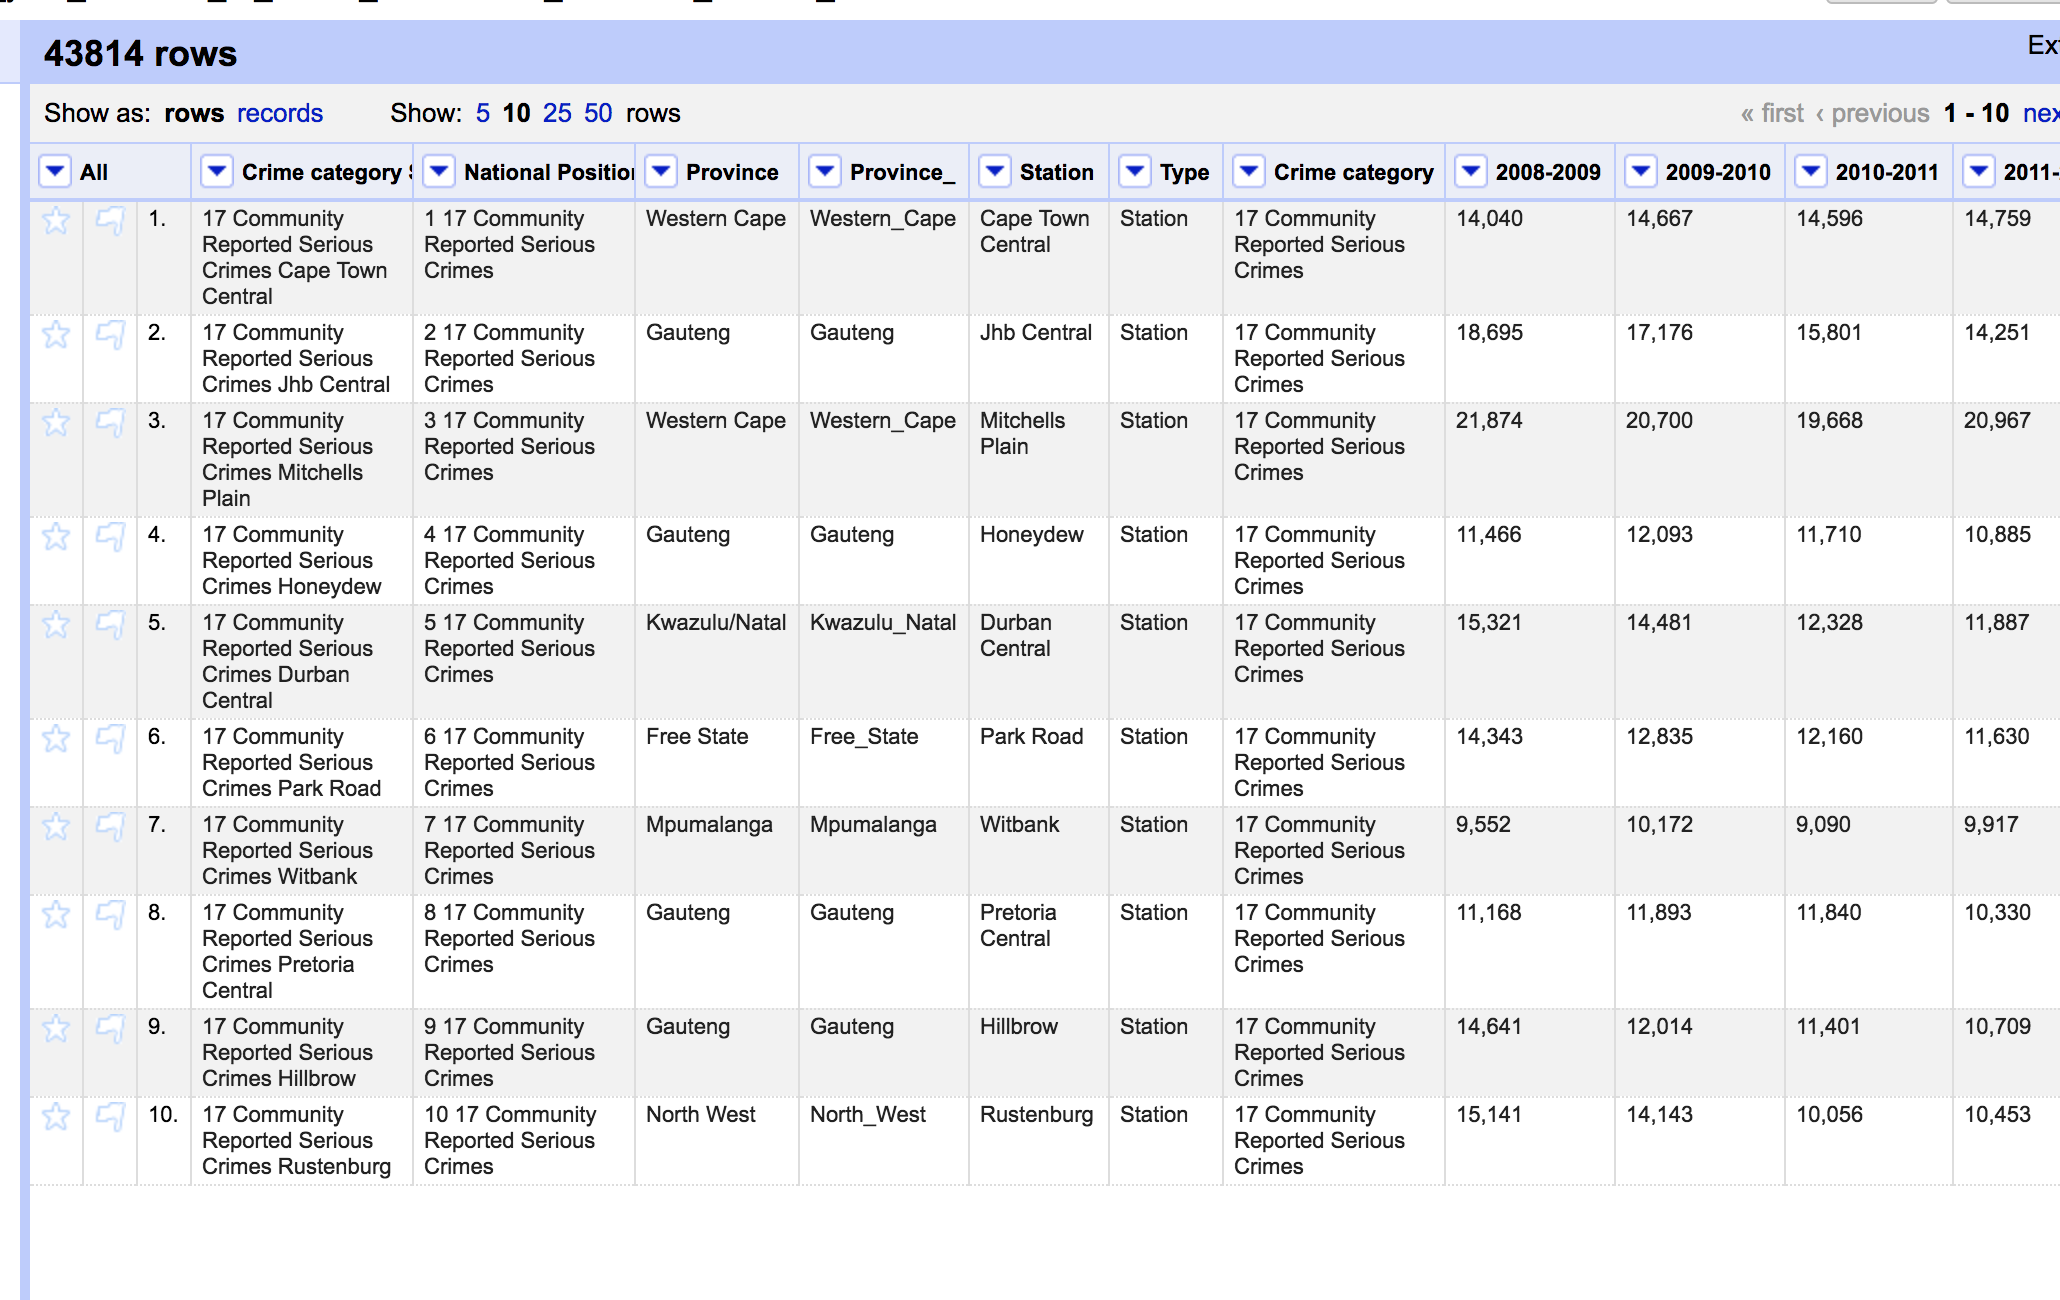
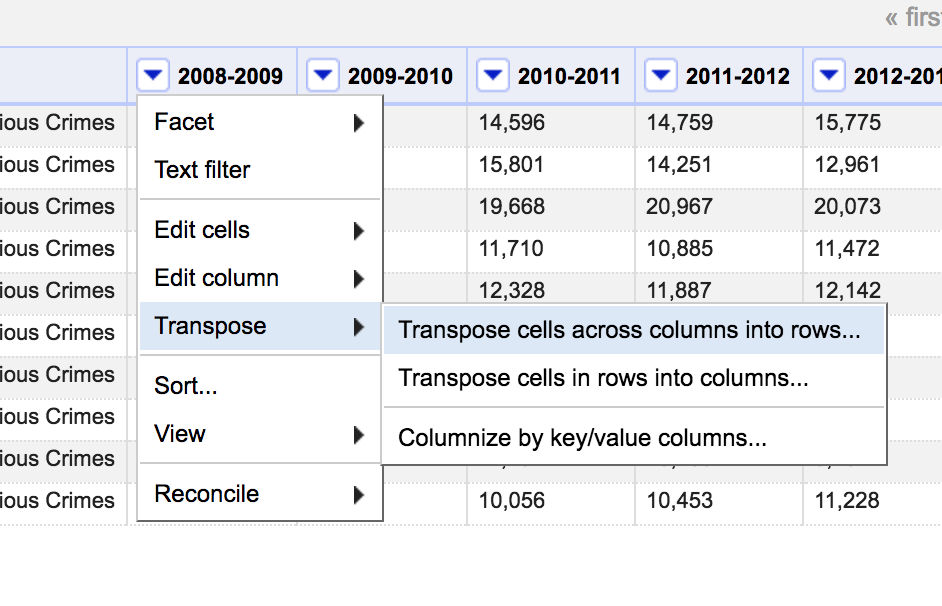
To work. Click on the triangle next to the 2008-2009 column. Select Transpose -> Transpose cells across columns into rows…
This dialogue box is where all of the action happens. Here you choose all of the columns that you would like to unpivot, and create the year and incidents columns that I mentioned earlier. From column should be the first column containing data, i.e. 2008-2009. To column is the last column, i.e. 2017-2018. Choose to transpose the data into two columns. The key column will contain the name of the column we unpivoted, in this case, it will be the relevant year. Value will contain the actual data, i.e. the actual number of incidents in that particular year.
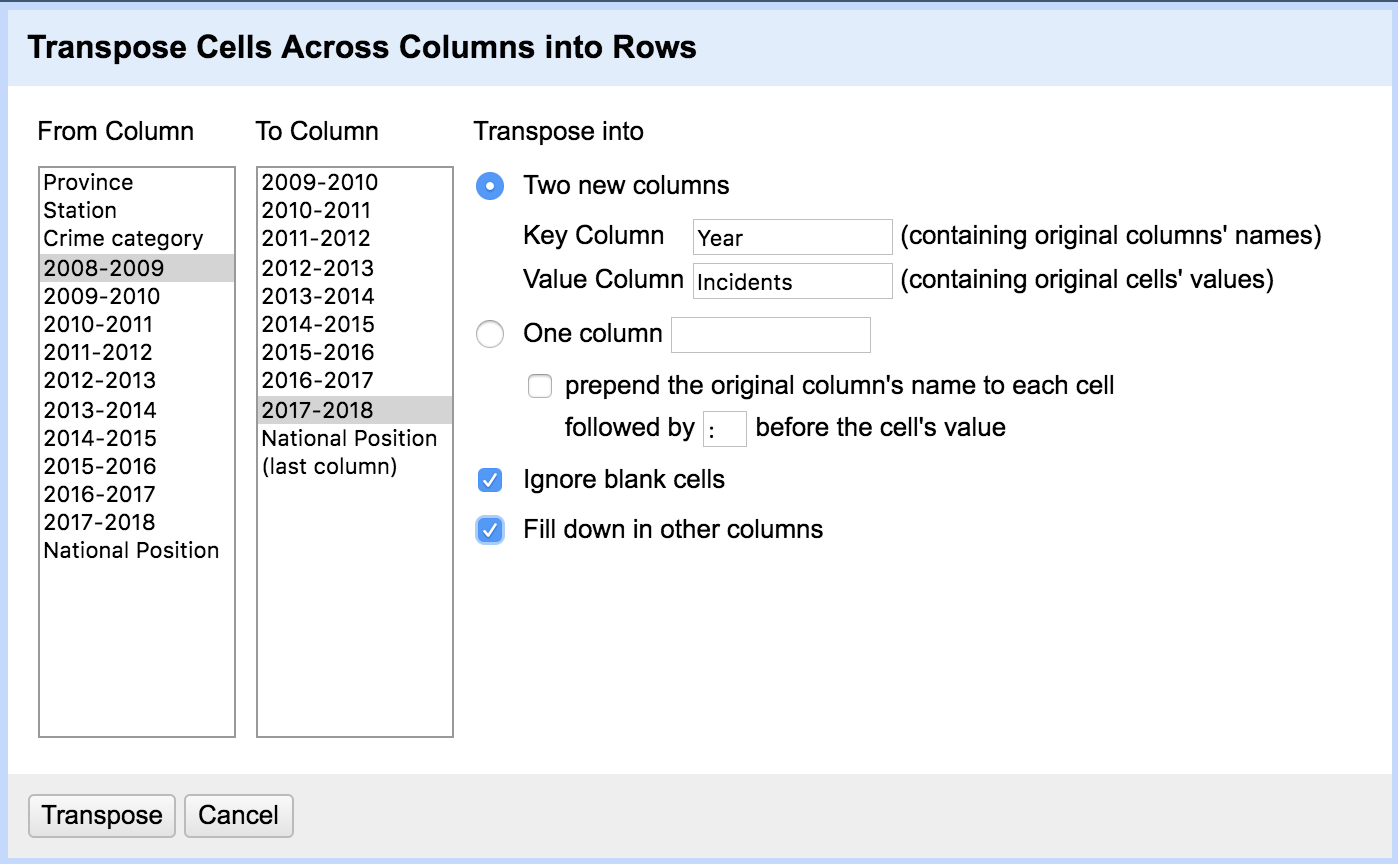
We should expect this operation to replace every row with 10 new rows, i.e. one per year.
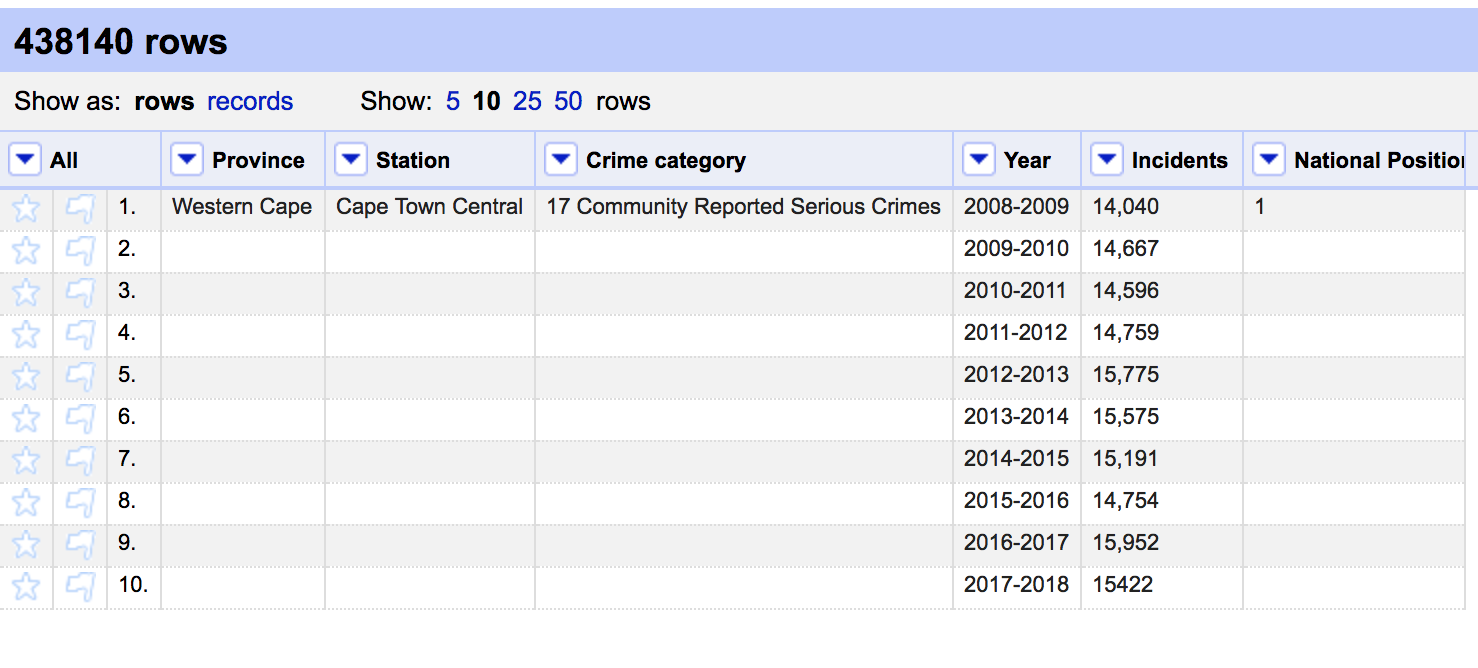
Be sure to select Fill down in other columns. This ensures that the name of the police station and crime category is duplicated for every new row. If you don’t do it, you’ll get this:
If we tick that box and apply this procedure correctly, you’ll get this dataset. Notice that we increased the number of rows ten-folder from 43,814 to 438,140. We no longer have columns for the individual years. These are now replaced by Year and Incidents.
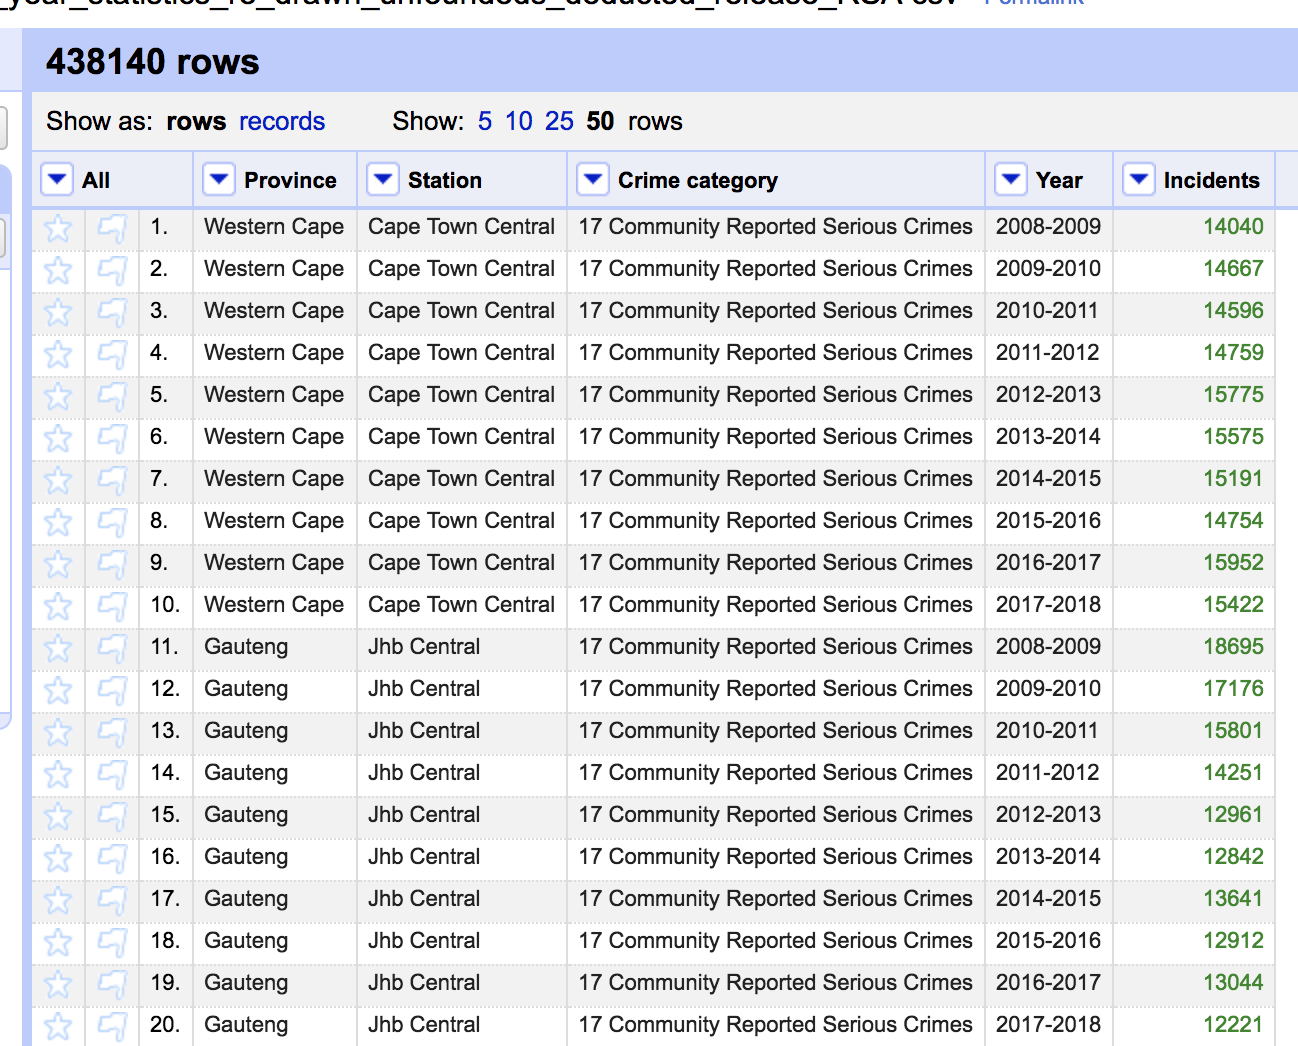
Done.
Note: you can download a clean dataset that I maintain here. It contains data going back to 2005 which is more than is currently available in the file listed above.


